Implementation
Goal: Learn that timing and synchronization are challenging, and run the first experimental procedure
Prepare for the lab
- Read about the stimulus presentation and order effects (This is a part of the eye tracker tutorial, but the know-how is generic. In addition, it has color pictures
)
- Skim through the Chapter 2 “Building Your First Experiment” in Building Experiments in PsychoPy (2018) (there is no need to remember how all windows look like; you only need to know what is the general idea of experiment preparation in PsychoPy)
- Note: Do you know that there is a dedicated folder on OneDrive with materials that are not publicly available online? Check the schedule section on main course page.
- If you are working on your own computer, install the latest version of PsychoPy before class.
Materials
- Short lecture: Implementation
- Q&A Session:
- Why don't we want to always use the same order of stimuli?
- How does random sampling with replacement differ from that without replacement?
- Practice session:
- Download and install the PsychoPy on your laptop/PC. We will use it during this lab.
- Run the PsychoPy3, e.g., in Windows: Start → PsychoPy3 → PsychoPy3. Three windows will appear:
- PsychoPy Builder – it is the GUI-based creator of experiments. No coding skills needed! It is our base for today.
- PsychoPy Coder – if you do not prefer GUI tools, here you can create, edit and run PsychoPy experiments written in Python code
- PsychoPy Experiment Runner – the log from experiments will be presented here
- Load the Stroop Task demo in Builder: Demos → Experiments → stroop
- If you do not see the Experiments, you need to unpack the demos first: Demos → Unpack Demos… (select any directory; PsychoPy will create a subdirectory called PsychoPy3 Demos there)
-
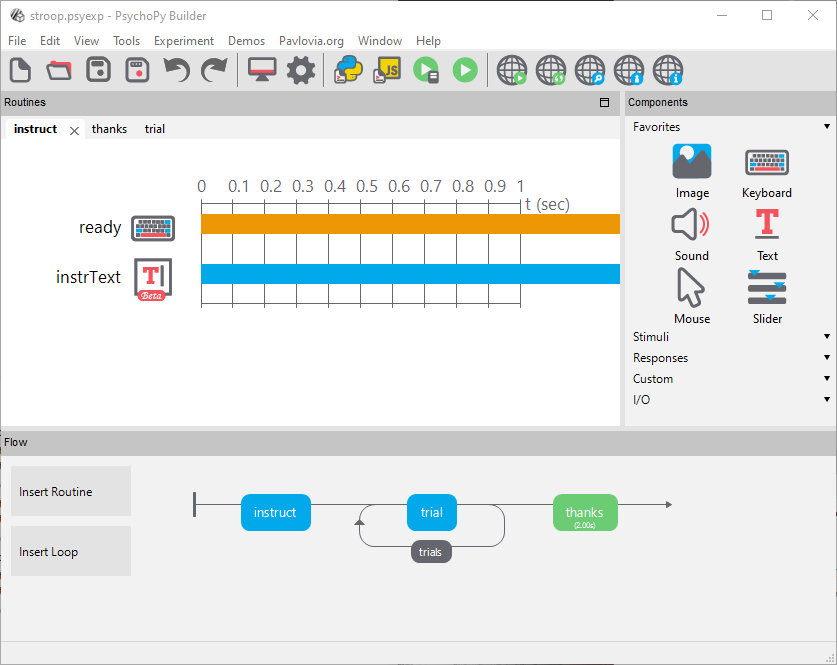
- The whole overview of the protocol is visible in Flow (at the bottom). There will be three parts in Stroop Task: instruct, trial repeated in loop, thanks.
- Each block from the Flow is visible as a separate tab in Routines (on the Figure above you can see the instruct routine).
- Finally, each line in the Routines depicts one Component.
- Explore the interface. Click on the flow's and routines' elements. Take a look at dialog windows that will pop-up. We will modify these values later - now, it's time for some exploration.
- Run the experiment:
- Just click the big green button with an arrow.
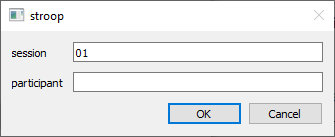
- Take part in the experiment! [there will be 30 items to evaluate]
- Go to the directory with the stroop (
PsychoPy3 Demos\Experiments\stroop\). data directory was created here - take a look! There are four files for each participant:[date].csvcontains the actual experiment results (i.e., the stimuli presentation log and the subject's responses) – it is the most important file![date].xlsxcontains a summary of the experiment – it do not add information and is not important at all.[date].psydatcontains a great deal of information from experiment; it is not easy to open, but keep it as a backup (you can recreate a[date].csvfile from this one if the original csv file will be lost)[date].logcontains execution log (the same log is presented in Experiment Runner window during the experiment) – it's a proper place to check whether the protocol was correctly executed and no errors occurred
- Open the
[date].csvfile in MS Excel/LibreOffice Calc/Google Sheets/any similar and perform the simple analysis of the Stroop Effect!- Sort the data by
congruentcolumn. The first half of the table will havecongruent=0(incongruent, i.e., text and colour are different), and the second will havecongruent=1(text and colour are the same) - Simply calculate the averages of
resp.rt(response.reaction_time) for both halves of the table - Have you observed the Stroop Effect on yourself?
- Now it is time to make changes to the experiment. Change the screen colour for the whole experiment (e.g., to black). Also, change the instructions font colour (e.g., to red).
- More important task: change the language of the colour names (you can also change the messages, but it is not required).
- If English is not your first language, then translate the study to your first language! If English is your first language, change it to French (red = rogue, green = vert, blue = bleu).
- Tip 1: there is a
trialTypes.csvfile inPsychoPy3 Demos\Experiments\stroop\directory. You need to create a new copy called, e.g.trialTypes-french.csvwith alternated contents (letterColorcolumn specifies the actual colour of the text; it should be written down in English or as an RGB value) - Tip 2: click on the
trialsblock in the Flow (in Builder) –Conditionsfield should be interesting for you
- Run the experiment one more time (now, with the new language). Analyse the data (as above). Have you observed the Stroop Effect now? Is it stronger or weaker than before?
- Now, examine the Reverse Stroop Effect. As you probably observed, the meaning of the word interfered with your ability to report the letter colour (i.e., Stroop Effect). But is there an equivalent effect in which the letter colour interferes with your ability to read? Stroop's original paper (linked at the beginning) suggested a lack of effect in this direction but he was running his study with paper ink and asking participants to call out the answers while he timed them on a stopwatch. Maybe with the somewhat more precise timing of modern computers we can reveal such an effect? Modify the protocol accordingly.
- Check also the extended version of Stroop Task. To do so, in Builder select: Demos → Experiments → stroopExtended. What was changed? How it was done in the Builder?
- Finally, if you want to see the Python code instead of GUI-based builder, you can simply select: Tools → Compile, and the whole code will be generated and opened in the Coder.
- Advanced session:
- Synchronisation of data streams is one of the most important concerns in psychophysiological research. We want to test how this works with a simple example: one stream of data will be provided by the stroop experiment (implemented above), and the other will be a random number generator simulating the EEG data stream.
- To begin with, read about Lab Streaming Layer (LSL). It is a library/system for streaming and syncing various data over local network (you can also synchronise the data on one machine, as we will do now).
- There are ready-to-use modules/applications/examples of LSL. Let's start with two of them:
- SendData.py is a simple Python program that generates random values and puts them in the LSL stream called
BioSemi. Simply run this program. Note: it is based on pylsl library. - App-LabRecorder is an application that records the data streams available in the local network. Simply run the LabRecorder. You should see exactly one stream, called
BioSemi– it is provided by theSendData.pyexample.
- Now it's time to work on your own: add LSL handling to the procedure in PsychoPy.
- Note 1: You can use the SendData.py code as an inspiration.
- Note 2: The use of the LSL consists of two steps. At the beginning (once, before starting the procedure), the appropriate data stream must be prepared using the
StreamInfoandStreamOutletclasses. Then, in the actual loop handling the stimuli, we send consecutive samples to the stream using thepush_sample()function. - As a result, the stream you created should appear in LabRecorder.
- Now just run the experiment and save all the streams for each subject in a separate file. And that's it. The LSL authors did all the hard work for us by preparing the appropriate system libraries that synchronise the clocks of various devices on the local network, and then preparing the application to dump the streams to a file.
Learn more!
Timing and synchronization
- Bridges et al. - 2020 - The timing mega-study comparing a range of experiment generators, both lab-based and online – an up-to-date comparison of timing precision in popular frameworks
- Artoni et al. - 2018 - Effective Synchronization of EEG and EMG for Mobile BrainBody Imaging in Clinical Settings – comparison of four signals synchronization methods (both online and offline); uses EEG and EMG, but the overall idea is more general
- Lab Streaming Layer (LSL) – a library/system for streaming and syncing various data over local network
Frameworks for psychological experiments
- PsychoPy – free, Python, Win/Linux/Mac
- Open Sesame – free, Python, Win/Linux/Mac/Android
- Expyriment – free, Python, Win/Linux/Mac/Android
- Psychtoolbox – free, Matlab/Octave & Python (a subset of functions), cross-platform
- E-Prime – paid, E-Basic, Windows
- Inquisit – paid, Windows
- Presentation – paid, own languages (based on C and Basic), Windows
- GorillaPsyc – paid, JavaScript, on-line
- Testable – paid, own “natural” language, on-line
- Free JavaScript libraries (the first two are most worth considering):
PsychoPy
- Peirce & MacAskill - Building Experiments in PsychoPy (Sage, 2018) – current lab was based on this book; if you want to learn the PsychoPy step-by-step, it is a good resource

