Introduction
- Last verification: 20220909
- Tools required for this lab: Pens and paper
Prepare yourself for the lab
- Some introduction/motivation:
Lab instructions
1. Data in the Wikipedia [15 minutes]
Wikipedia contains a huge amount of information, so it can be used as a source for various summaries. Is it a convenient source of knowledge? Let's check it out!
- Your task is to prepare a list of the 15 most populous countries in Europe based on Wikipedia. Do NOT use any other websites for this purpose. The ready-made lists available on Wikipedia are NOT reliable, as they often have outdated numbers!
2. Wikidata and DBpedia [10 minutes]
Processing Wikipedia data was tedious, huh? Luckily, there are DBpedia and Wikidata! Both enable machine learning processing of Wikipedia data.
- We don't need no introduction…
Simply go to the page: https://query.wikidata.org/. Click onExamples, selectCountries sorted by populationand clickExecute(the big arrow button). - Whoa, we have an up-to-date list of countries sorted by population! How does it work?
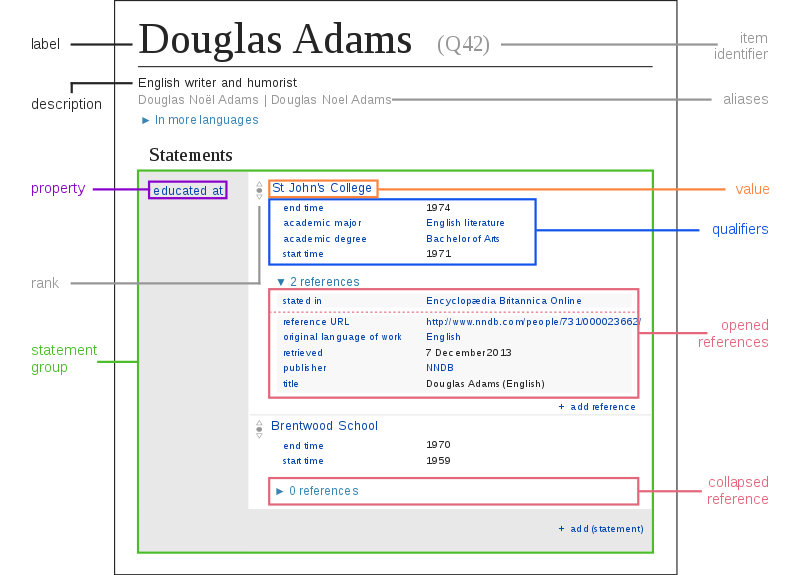
- Look at wikidata/Poland page and figure out how all the knowledge is stated here. The picture below may be helpful in understanding:

- Actually, the whole thing is very simple: we have an entity (this is the page we are on), some property (on the gray background, in the left column) and some value (on the white background).
- Have a look at other example queries for Wikidata at https://query.wikidata.org/. You don't need to understand them now, just see what the possibilities are - we'll come back to this in a few weeks.
3. Linked Open Data [10 minutes]
Wikidata isn't the only one that stores data that's easy for machine processing…
- Read about the Linked Data idea (and the original note by T. Berners-Lee, plus the 5 star system)
- Analyze the clickable LOD diagram, choose 3 interesting datasets and in a few words describe them to your colleague.
4. FOAF [10 minutes]
You can easily create such data yourself!
- Read about FOAF (the pre-Facebook social network!).
- Create your FOAF file with: foaf-o-matic
- Save your FOAF file.
- [If you have the possibility] Publish your file so that it can be referenced with URL. Then, visualize your FOAF file with FOAF.Vix. Simply put the URL as an
uriargument to the FOAF.Vix, e.g.: http://foaf-visualizer.gnu.org.ua/?nocache=1&uri=http://krzysztof.kutt.pl/foaf.rdf- We need the direct URL of this file. If you are hosting the file using the Dropbox, change the www.dropbox.com to dl.dropboxusercontent.com in the sharing link, e.g.:
https://www.dropbox.com/s/kc3g05y0k7t1mbw/foaf.rdf  # sharing link generated by Dropbox
https://dl.dropboxusercontent.com/s/kc3g05y0k7t1mbw/foaf.rdf  # direct URL for SPARQLer
5. Images annotation [5 minutes]
- Open Image Annotator
- Enter URL for some image you like
- Select some regions on the picture and add descriptions for them
- Generate file using “Show JSON-LD” button
- Analyse the file. How regions' information is represented?
6. RDF model (and Mona Lisa) [5 minutes]
- RDF model is a directed graph built from Statements a.k.a. triples
- Each Statement consists of: subject, predicate and object
- Subject can be an URI or an empty node
- Predicate can be an URI
- Object can be an URI, an empty node or a literal
- It is very informal and vague… So we can make it more concrete using URIs for every element in the graph. Note that we are using existing vocabularies: FOAF (
foaf:) and Dublin Core (dcterms:).

- Every arrow represents now a simple RDF Statement (RDF triple).
- Compare this to the knowledge stored in Wikidata that you looked at earlier - do you see similarities?
7. Modeling knowledge with RDF graphs [30 minutes]
RDF is a data model based on principle of representing relational information as labeled directed graphs.
- In this task you will represent a piece of knowledge with use of the RDF graphs. Firstly, select one of the topics (we will use this topic on subsequent labs):
- The Bold and the Beautiful – you can use a The_Bold_and_the_Beautiful#Premise section on Wikipedia (or the polish one)
- The Game of Thrones – you can use a A_Song_of_Ice_and_Fire#Plot_synopsis section on Wikipedia
- Another complex story from a book/series/movie you like
- Read the selected fragment and extract as much information as you can.
- Draw a graph (yes, with a pen and paper) representing the relations you identified in the fragment. Of course, “there's more than one way to do it”.
- Draw regular resources (i.e. representing persons, places etc.) as oval nodes. Draw datatype values (e.g. dates, numbers representing age etc.) as rectangular nodes.
- You don't need to write URIs, simply identify the resources with names and surnames etc.
- Keep your sketch in a safe place – we will use it on the next lab!
Learn more!
Reading:
- RDFS enables simple reasoning: Patterns of RDFS entailment
Common vocabularies:
Tools:
- RDFShape – RDF conversion, RDF/SPARQL/ShEx/SHACL playground
- RDF Editor developed at AGH UST (by Artur Smaroń, EIS 2015-2016)
Others:

